PC Software UI Manual
V1.00.00
0.1 Version & Update
Due to the complexity of the features, software/firmware/hardware can vary frequently, this manual might not be applicable for the latest software/firmware/hardware release.
0.2 Revision History
Nothing so far.
1.0 Connect the meter
Connect the meter and PC with a micro USB cable.
Open PC software, you should be able to see something like the following:
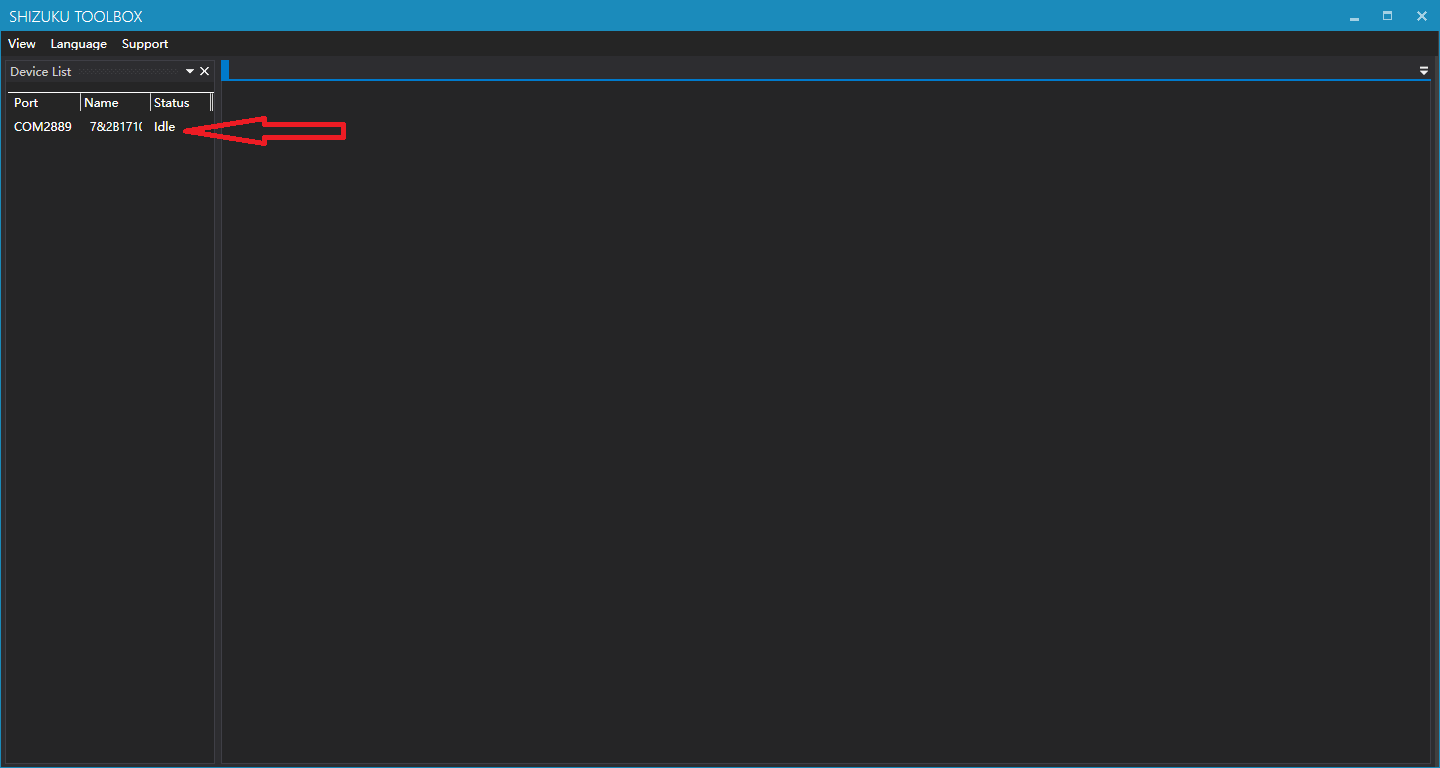
The red arrow points to the device we’ve just connected.
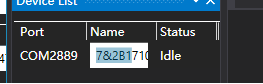
You can click the name of the meter to rename it, it’s used to differentiate them when multiple meters are connected.
Double-click the device, the following should be shown:
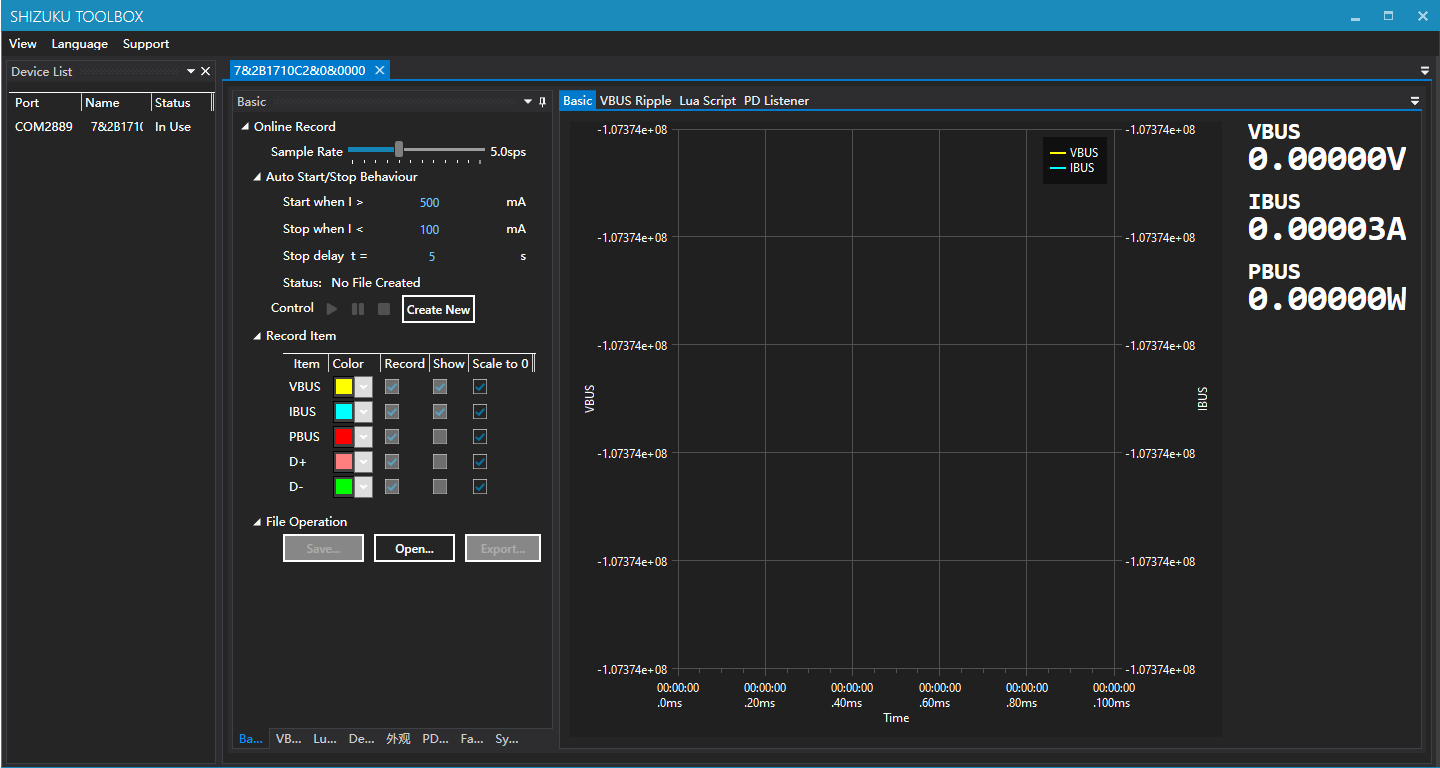
Now we will introduce the features one by one:
2.0 Basic(Data Logging)
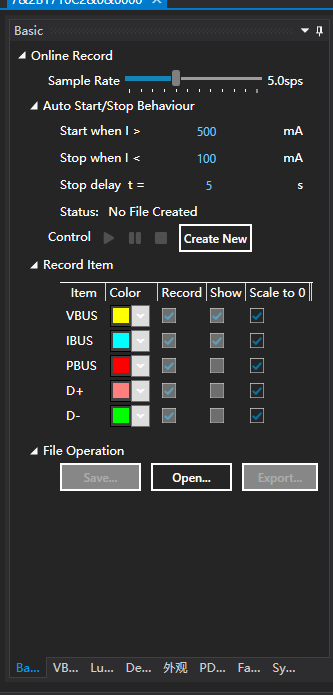
2.0.0 Create New
Click “Create New” to create a new record.
2.0.1 Sample Rate
Drag to adjust the sample rate of the record, range 0.2-1000sps.

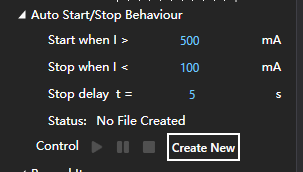
2.0.2 Auto Start/Stop Behavior
After clicking the start button, the record will not start immediately. The program waits for the current to go above Start Current, then it starts record. If you want the record to start immediately, you should set Start Current to 0.
You can specify a current, below which the record stops automatically. If this value is specified as 0, the record will never stop automatically.
To prevent instantaneous low current triggered stop condition unexpectedly, you can set “Stop Delay” parameter, only the current is below the stop threshold for a certain amount of time(Stop Delay t), the record will be stopped.
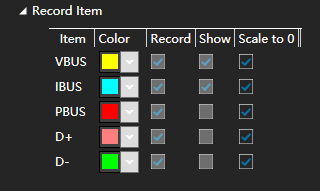
2.0.3 Record Items
To change the color of a record item, click the color combo box.
Check/Uncheck “Record” column to specify items to be recorded.
Check/Uncheck “Show” column to specify items to be graphed.
Check/Uncheck “Scale to 0” column to specify if a item is graphed relative to 0 (That is, force the lower bound of the graph to be 0).
2.0.4 File Operation
Click “Save…” to save the current opened record as file (The record should be stopped).
Click “Open…” to open existing record files (Including offline record created by meter itself).
Click “Export…” to export the current opened record as CSV file to process the data with other application.
2.0.5 Online record typical procedure
- Click”Create New”.
- Adjust
Sample Rate,Auto Start/StopParameters to proper values, check items you want to record. - Click green start button.
- After manual/auto stop, analysis/save/export the record.
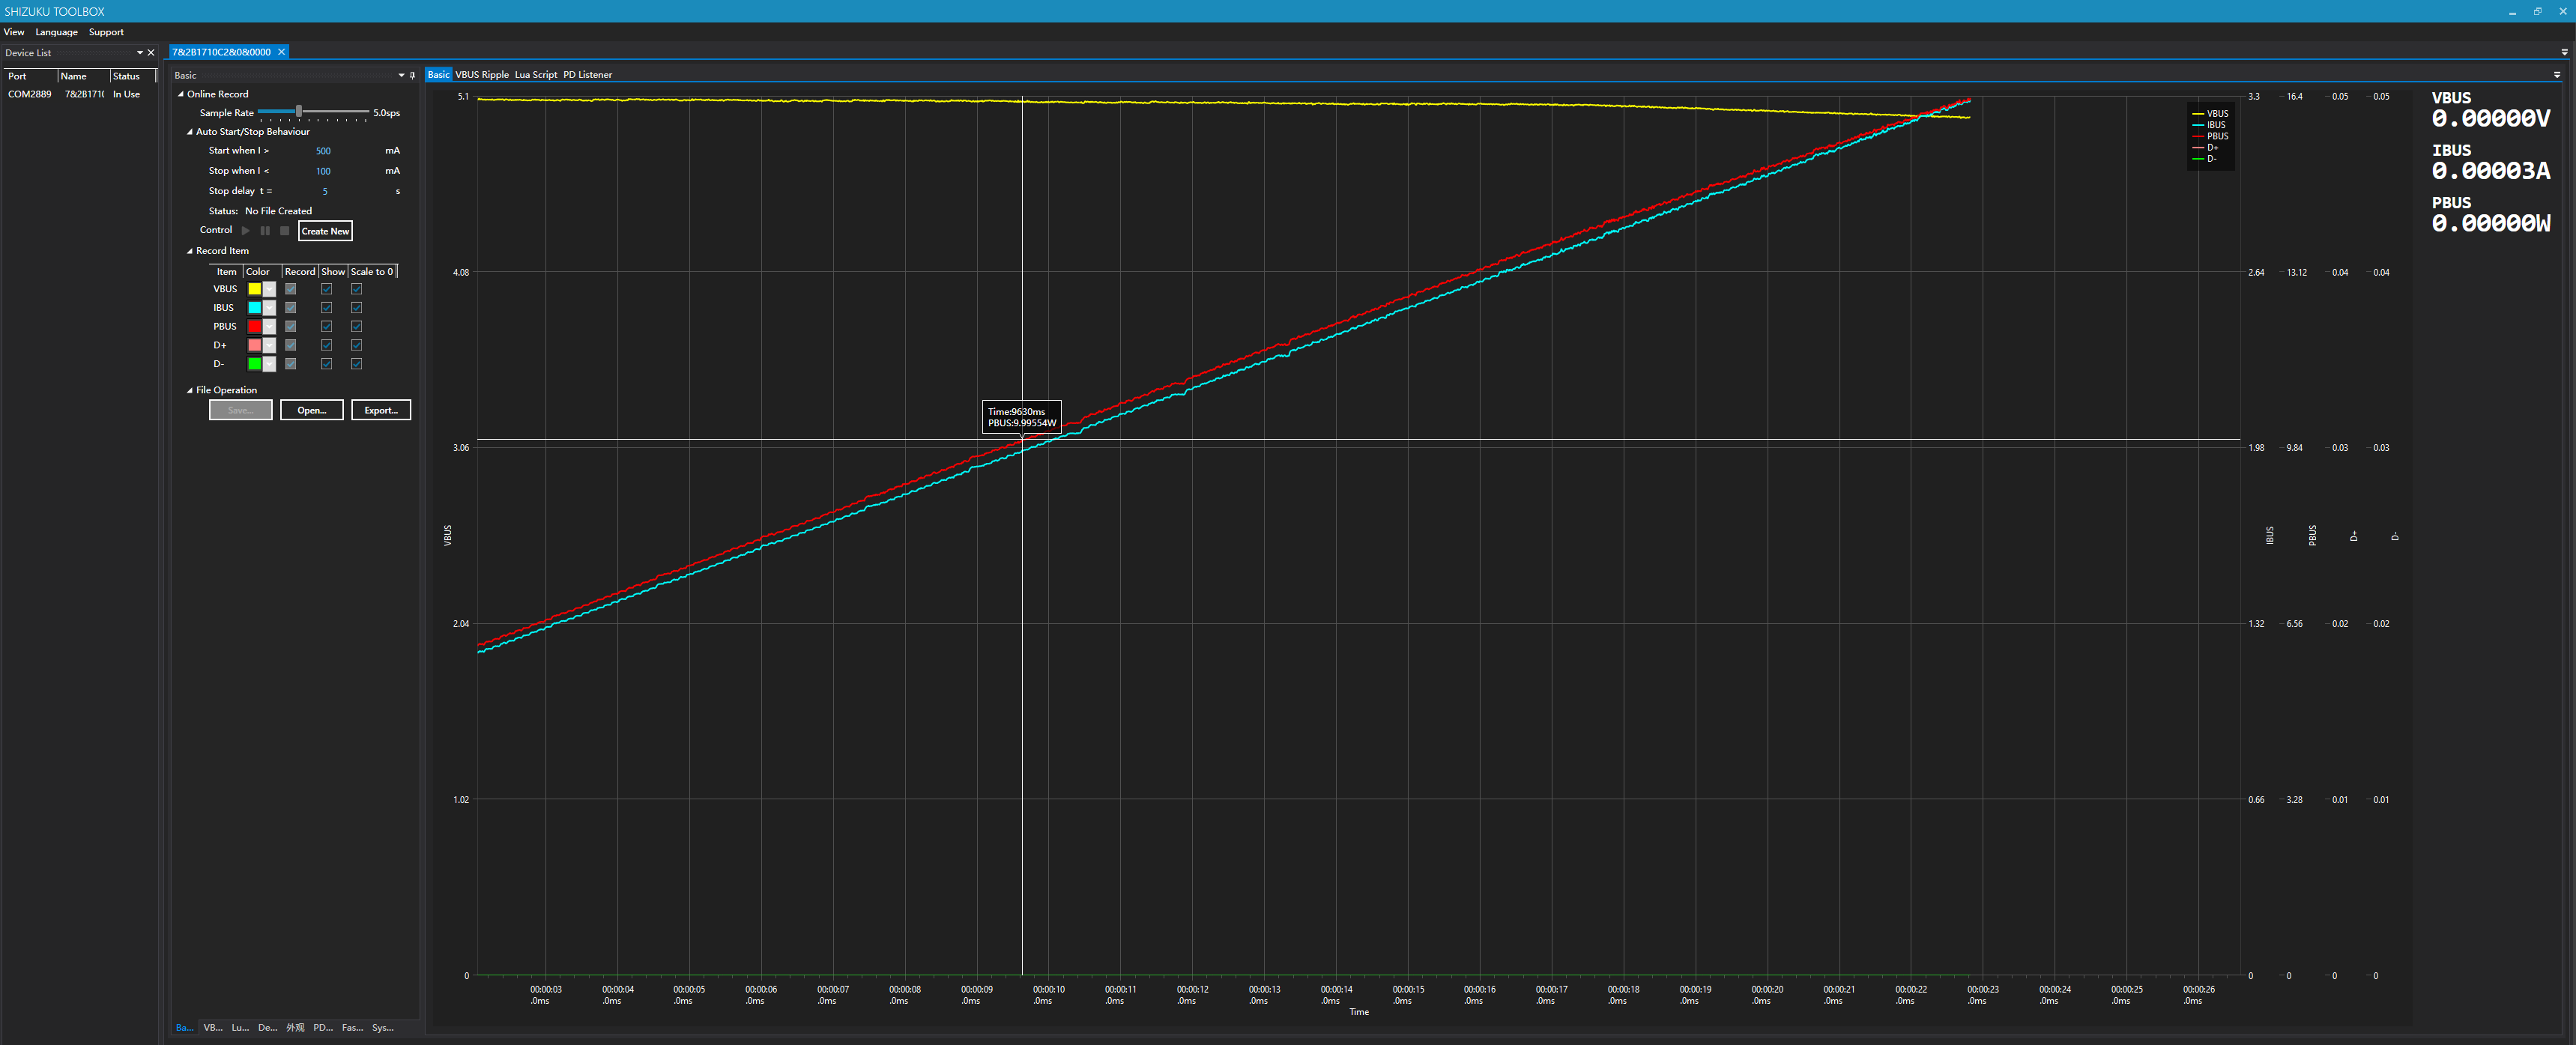
2.0.6 Graph Area
Click and hold some point on the graph, to view detailed value at that point.
Right click and drag to move the graph horizontally.
Use the wheel to zoom in/out.
2.1 VBUS Ripple
View AC-coupled voltage on VBUS:
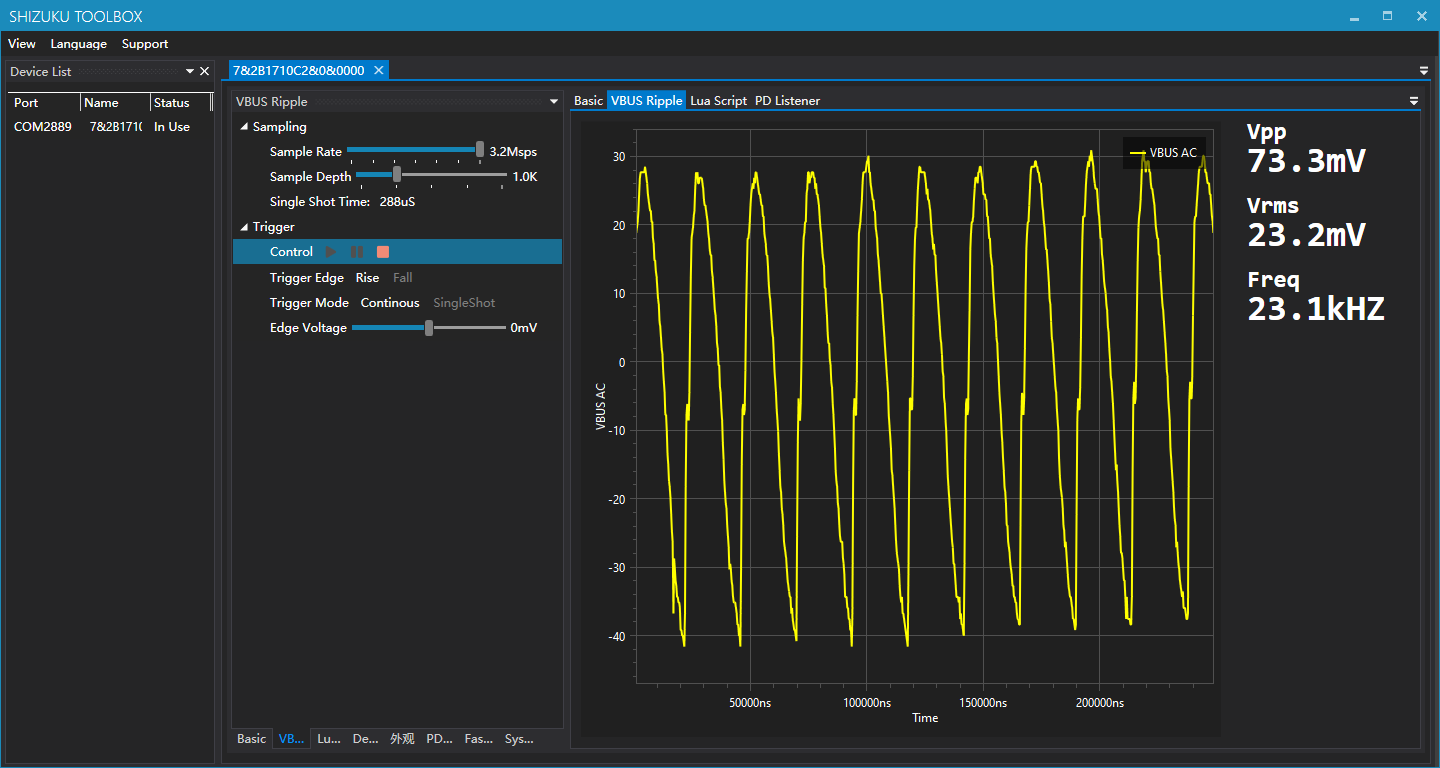
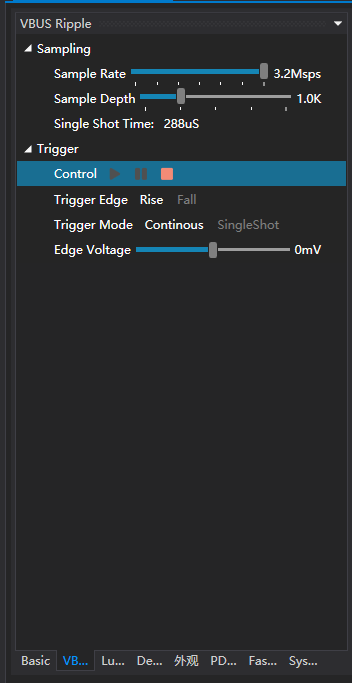
2.1.1 Sample Rate
Drag to adjust the sample rate, range 0.1-3.2Msps.
2.1.2 Sample Depth
Drag to adjust the sample depth (How many points are contained per sample).
2.1.3 Trigger Edge
Click to select the trigger edge.
2.1.4 Trigger Mode
Click to select the trigger mode.
2.1.5 Edge Voltage
Drag to specify the edge voltage.
2.1.6 Graph Area
Graph area is on the right side of the screen.
Click and hold a point on the graph to see precise value on that point.
Right click and drag to move the graph horizontally.
Use the wheel to zoom in/out.
2.2 Lua Script
This article only describes lua related features on the software, for more information, please visit: TODO TODO TODO
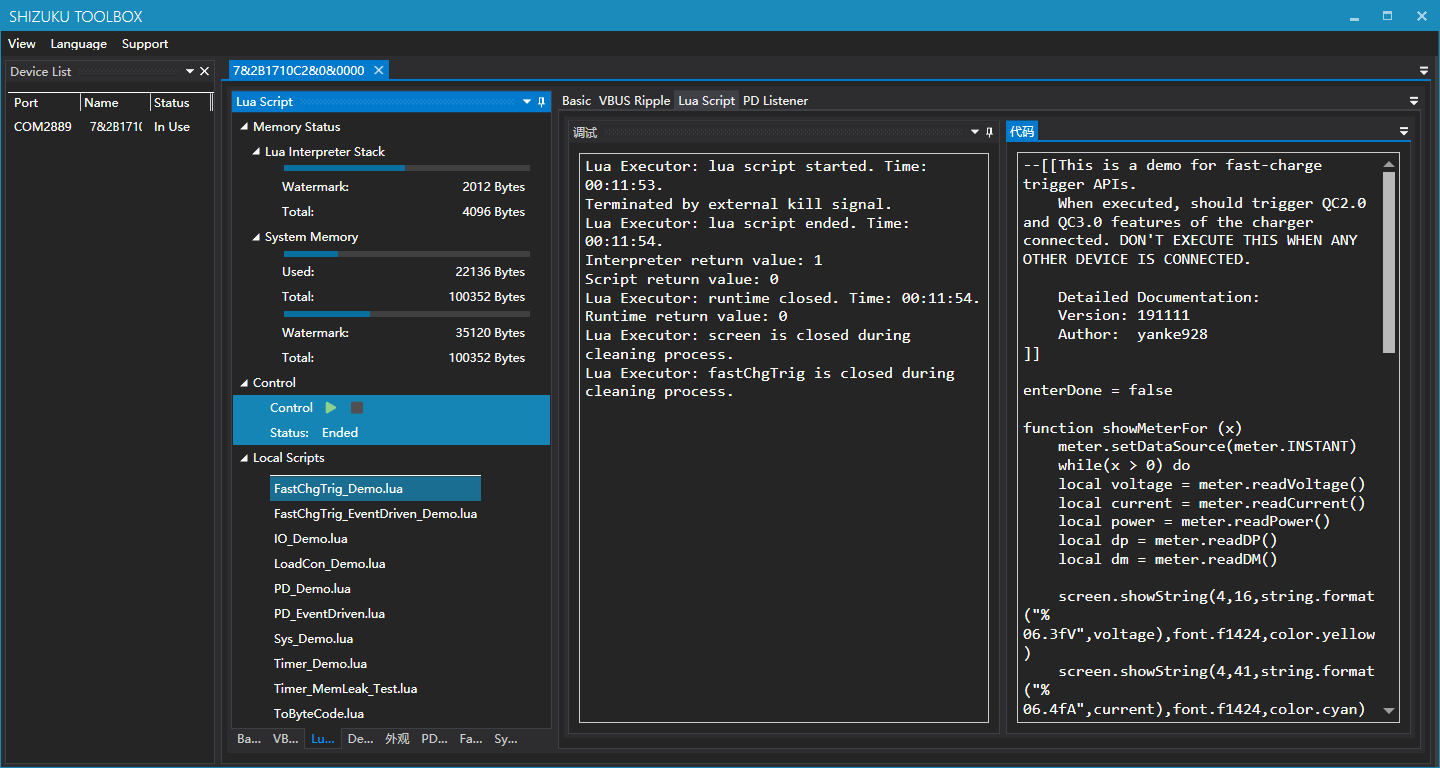
2.2.1 Memory Status
Real-time memory status is shown here.
2.2.2 Local Scripts
Here local scripts are listed, example codes are stored by default.
2.2.3 Debug
This is the output terminal. Outputs of Lua program, Lua executor, Lua Interpreter are all here.
2.2.4 Code
Currently loaded code, click green button to download and execute.
2.2 FastCharge Trigger
You can use fast-charge trigger feature on the PC software as well as the meter itself.
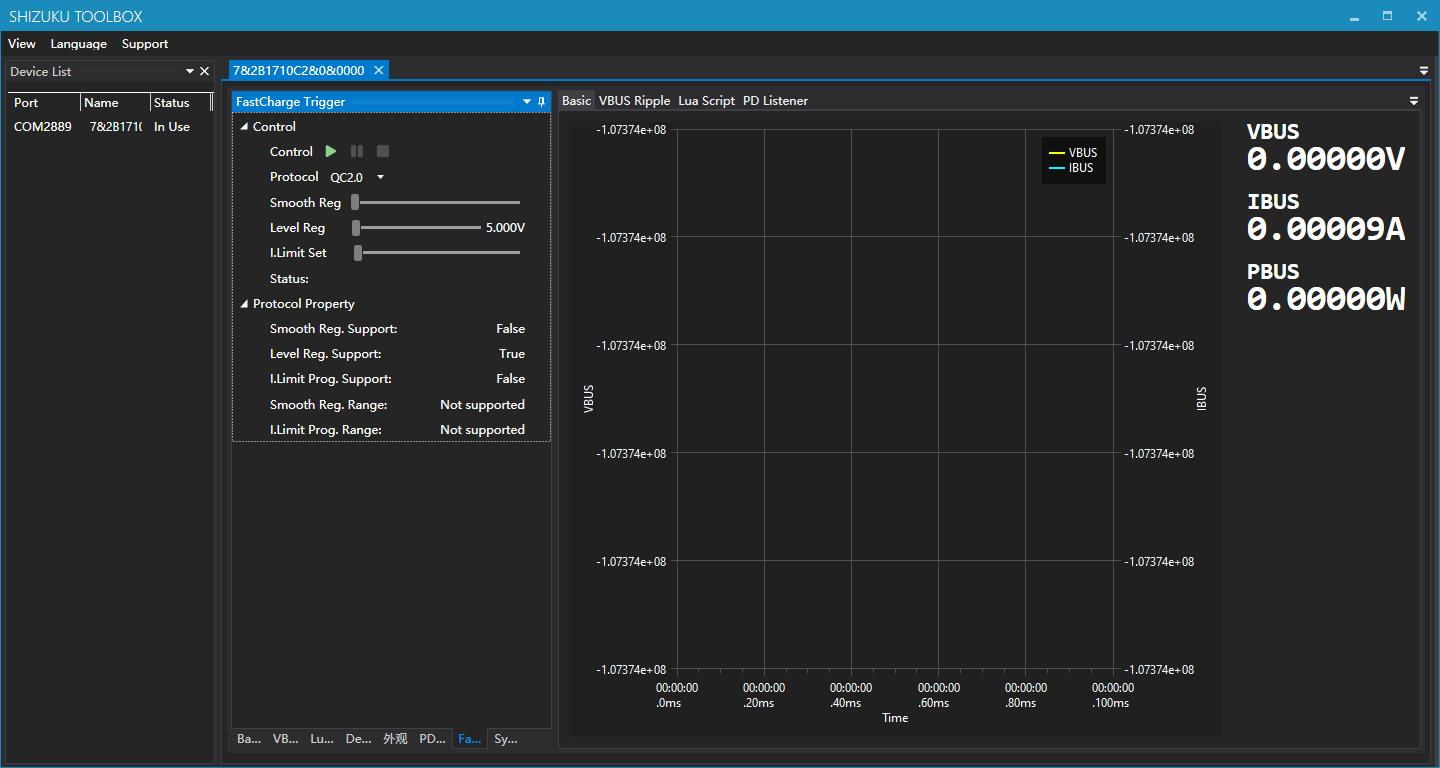
2.3.1 Select the protocol
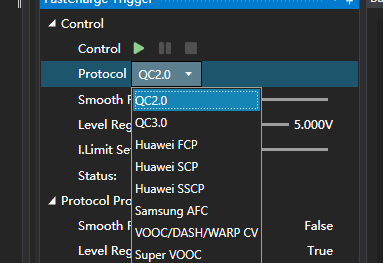
Select the protocol being triggered here.
2.3.2 Protocol Properties
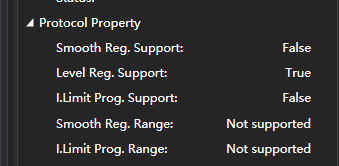
Here properties of the protocol you’ve selected are shown.
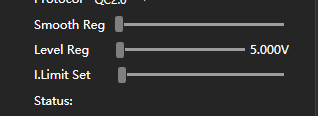
2.3.3 Adjustment
After click the green start button, you can make adjustments on voltage and current limit:
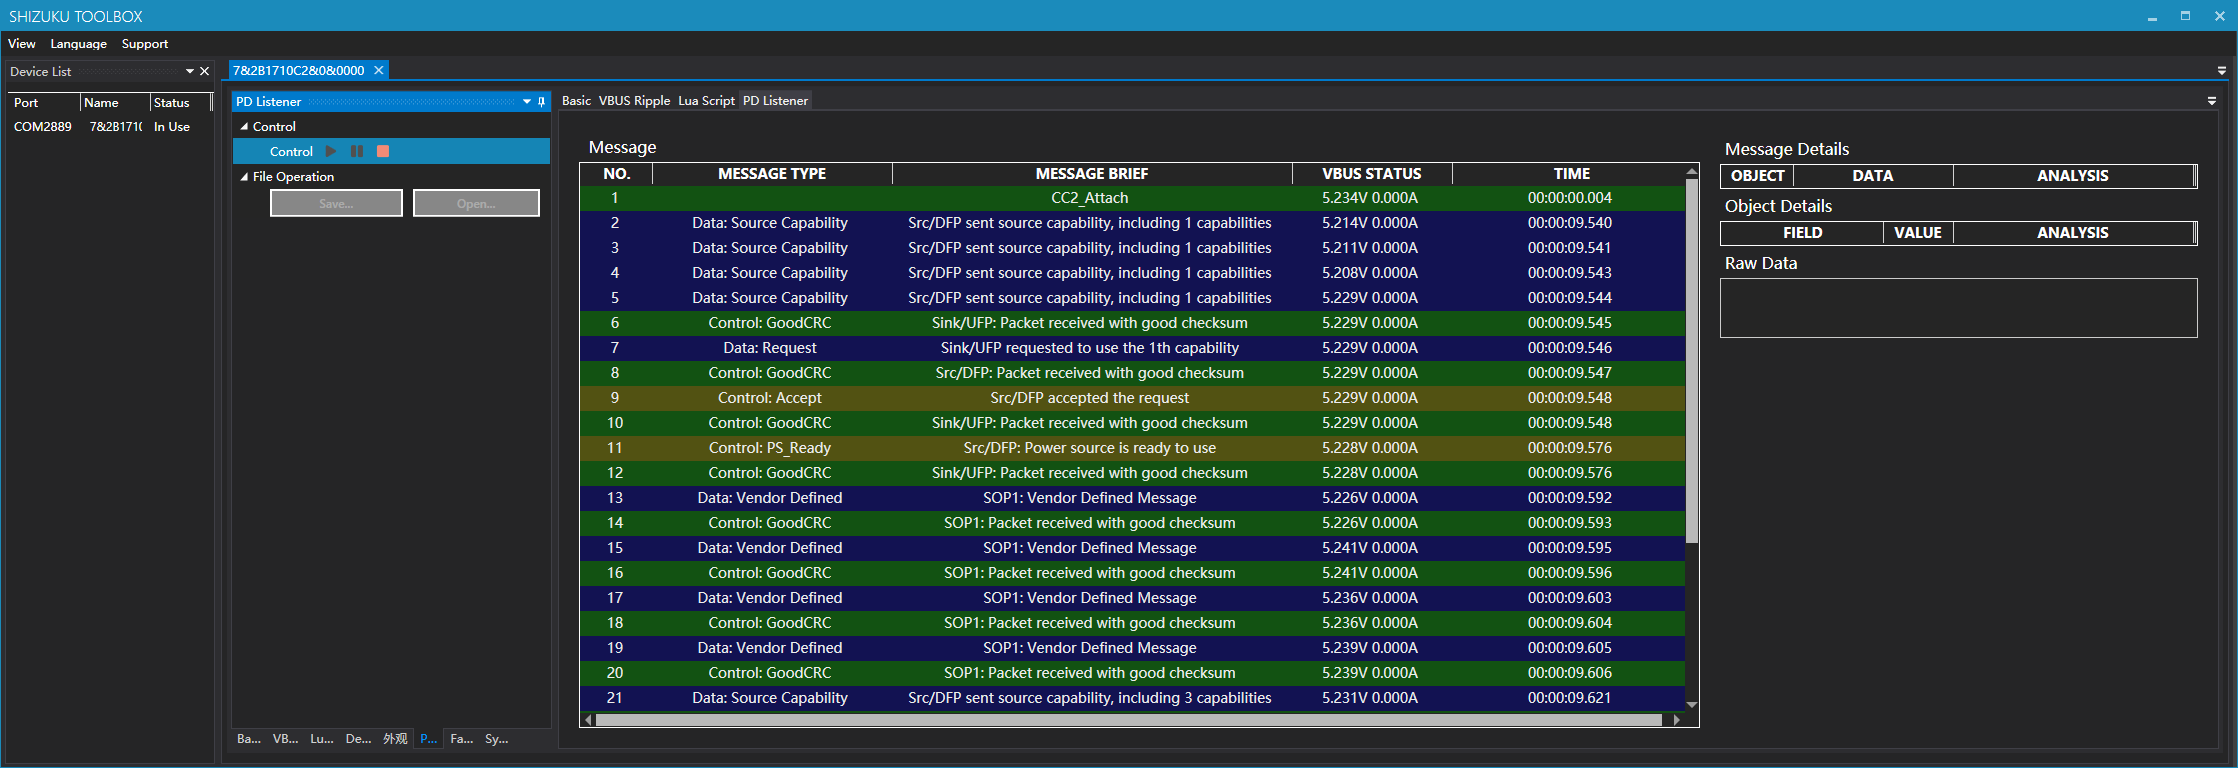
2.4 PD Listener
To use listener, please follow the following procedure strictly:
- Make sure PD communication switch is on the “ON” position.
- Connect the charger and the meter with a C-C cable.
- Click green start button.
- Use another C-C cable to connect the other Type-C port to your being tested device.
- If you expected some message to appear but it didn’t, you might need to flip one of the Type-C plug connected on the meter.
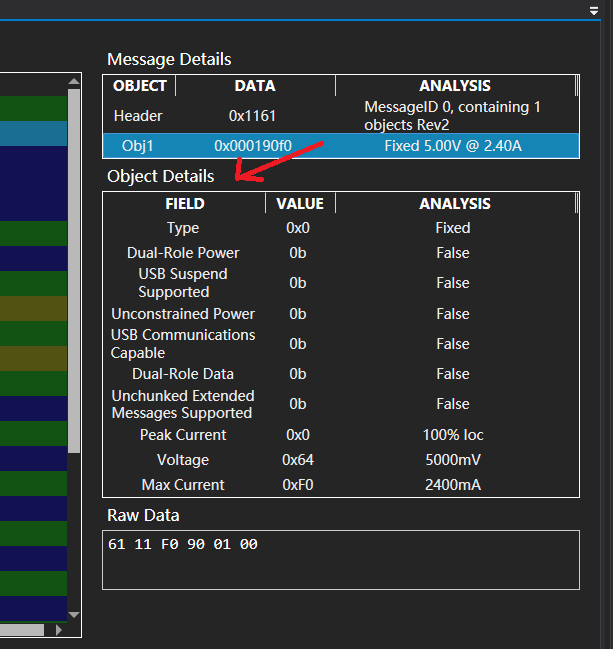
2.4.1 Message Details
Click a message and you’ll see message details on the right side:
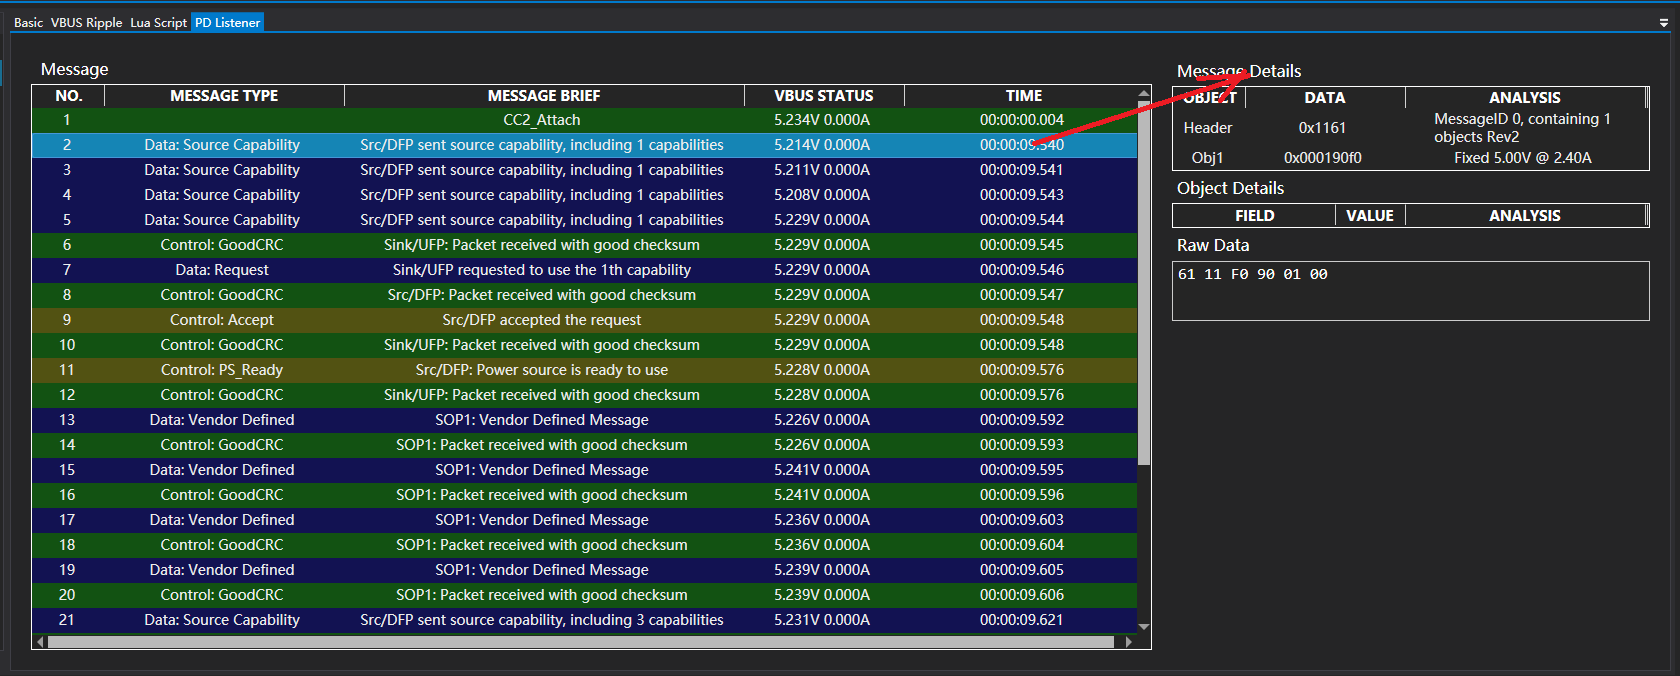
2.4.2 Object Details
Click a data object and you’ll see object details on the bottom:
2.4.2 File Operations
You can save and open PD listener stream:

2.5 System
2.5.1 Firmware Update
Click “Update” to perform a firmware update, this process should take around 20 seconds.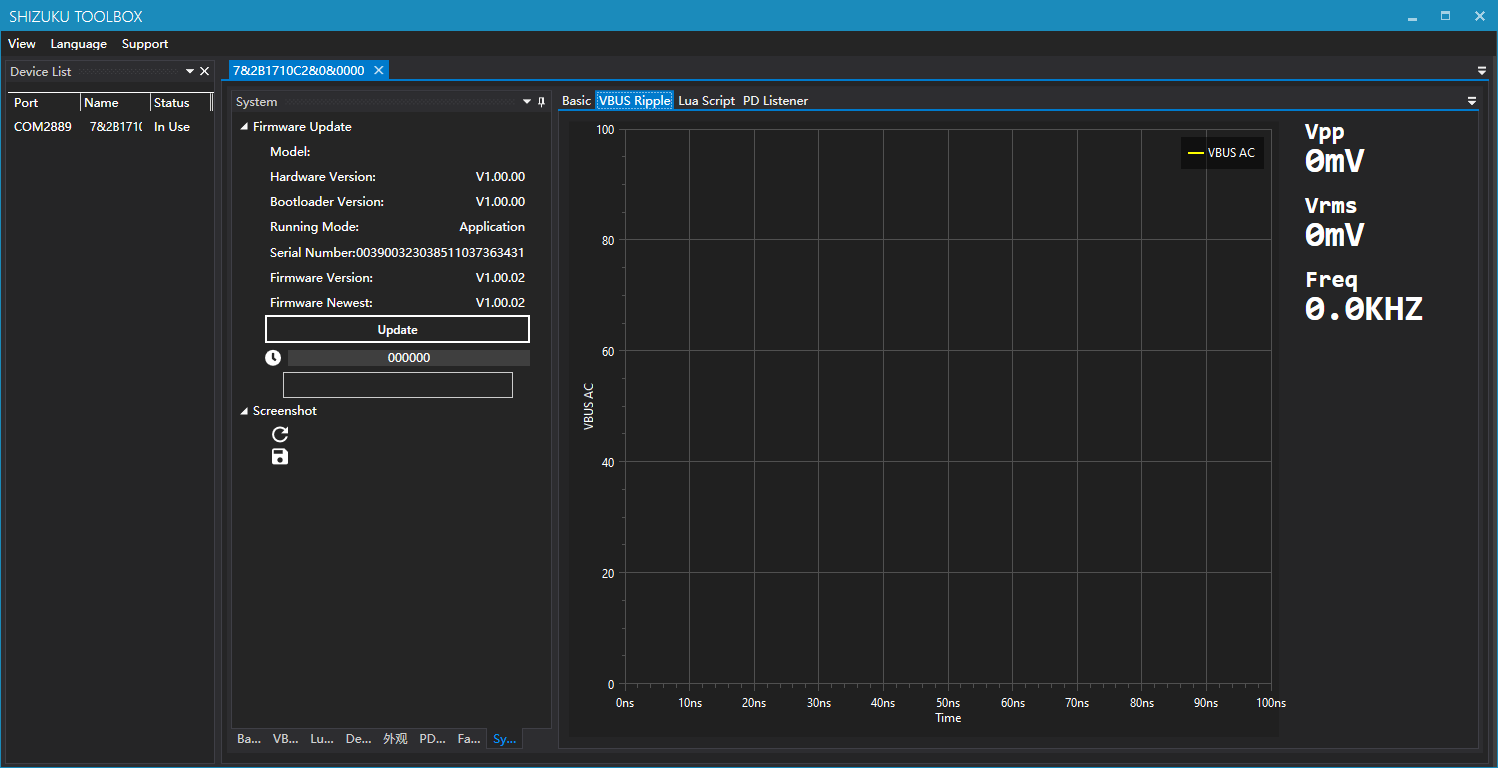
2.5.2 Screenshot
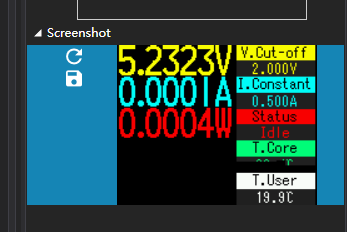
Click refresh button to capture new screenshot, click save button to save the screen shit.
Notice that some UI might not be able to be captured (Mostly graphing like VBUS oscilloscope, VBUS & IBUS graph), as they utilizes different graphic mode.
https://yk-lab.org:666/index.php/lua-programming-overview/
https://yk-lab.org:666/shizuku/manual/software/manual-pc-en-us/content.html
where can i get the firmware for the ct-3 usb meter
Hi
https://forum.avhzy.com/forum.php?mod=viewthread&tid=190&extra=page%3D1
Hello, we are interested in qty 50 for an aircraft test. We need to know that if the CT-3 +Load (sm-ld-00) is programmed to power up into PD listener mode, set up the load to 20V at 3A Constant Current and then after a charger overheats and wants to reduce the power to 45W max to then drop the charge current to 15V at 3A or less.
Also if someone can contact me we are interested in paying $ someone for the programming.
Mark J Worden Astronics, AES
US 1+4255564591
I am using the CT3 power meter. The thing is how can I convert the output(recording file) which is in SHIZUKUREC format to something readable like CSV or Jason file.
There is an export button when you open your record.
Hello customer, there is a detailed introduction on page 13 of the manual.
Manual download
https://forum.avhzy.com/forum.php?mod=viewthread&tid=190&extra=page%3D1
Comment *I am trying to communicate with my CT-3 using TCP and lua script, I’ve been able to do this and also I’ve been able to make the script run on boot so that I need to make the whole process programmatically in order to implement it inside my automation test solution, I only have one issue that I must enable the LUA TCP forwarding myself from the Shizuku system box.exe.
When I searched for a solution I found that I can call UserTCPUtils.exe and pass it the COM port and the TCP port that we are forwarding through.
for example I should call this command in the terminal
UserTCPUtils.exe -s COM15 -t 55210
But When I call it nothing happens, the terminal does not get any response and it remains waiting unit I close or cancel the command, and the TCP forwarding port remains closed, I’ve checked it using the communications through PUTTY and also it was closed in the Shizuku system box software.
What are the differences between CT-3 and CT-A ? No information on Amazon.
Thank you !
Is the software also supported on Mac OS? Or it only be supported on Windows?